
What should a small-business KPI dashboard show?
Title: KPI Dashboard Examples Every Small Business Owner Can Copy
Meta description: Copy practical KPI dashboard examples for sales, cash flow, marketing, and operations, plus tools, data sources, setup steps, costs, and timelines for small businesses.
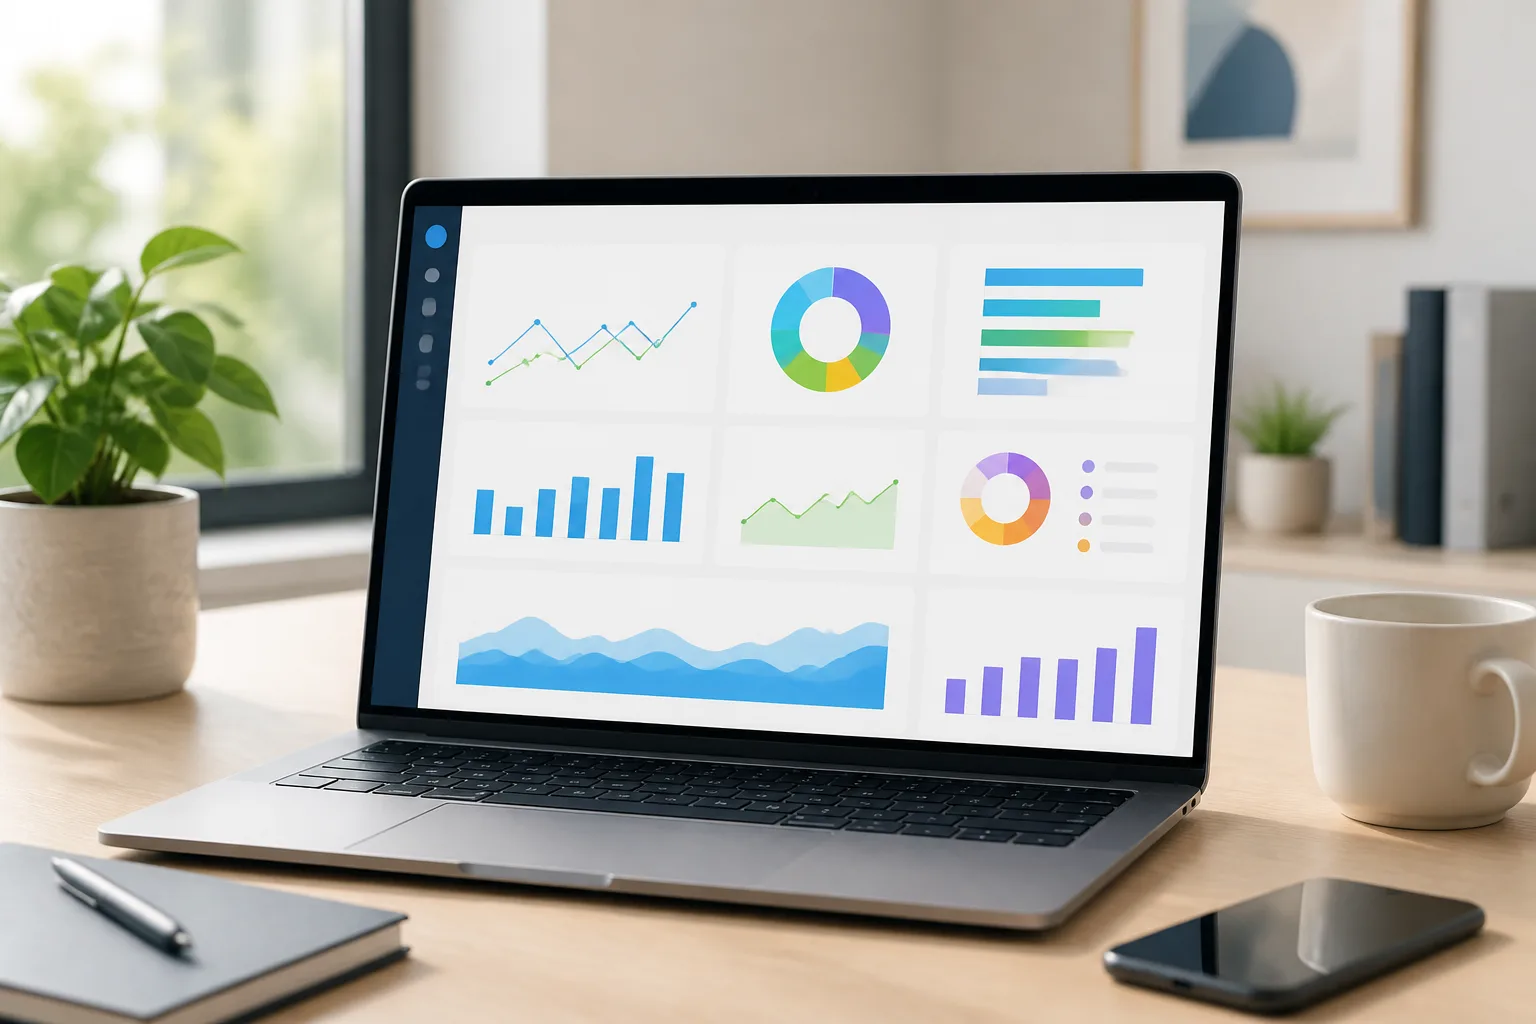
A useful dashboard shows a small set of business measures, makes meaningful changes easy to spot, and helps you decide what to do next. A KPI dashboard is a visual report that tracks selected key performance indicators against goals or comparisons. These KPI Dashboard Examples Every Small Business Owner Can Copy start with sales, cash flow, marketing, and operations.
The right dashboard helps answer a decision you actually face: whether to follow up on a slowing sales pipeline, protect cash for upcoming bills, adjust a marketing channel, or address delayed work. It isn’t a display of every number your accounting, sales, or web tools can produce.
Start by asking what you want to notice early and what action you could take if the measure changes. A retailer might need to see daily sales and stock availability, while a consultancy may care more about qualified proposals, billable work, and invoices awaiting payment. The useful measures differ because the operating decisions differ.
Keep the first view focused. If you have to scan many charts to find the signal, the dashboard may be collecting data without helping you manage the business. Choose measures with clear definitions, reliable sources, and a person who will review them. The KPI dashboard examples below are starting points, not required metric lists or universal performance targets.

Compare dashboard design offers
Which KPIs belong on a small-business dashboard?
Choose a KPI by connecting it to a business goal, assigning someone responsibility for it, and deciding how often to review it. A measure earns space on your dashboard when it helps you make or evaluate a decision. Define its calculation and comparison before you rely on it.
It helps to separate outcome measures from activity or process measures. Revenue is an outcome: it tells you what came in. Qualified leads, sales calls, or proposals sent are process measures that may help explain why revenue changed. Looking at both can reveal whether the issue is demand, follow-up, conversion, or another part of the process.
Use this selection sequence before adding a metric:
- Name the decision. For example: Should you increase follow-up on open proposals?
- Choose a useful measure. You might track proposals awaiting a response, alongside closed sales.
- Define the calculation. State which records count, what date field applies, and how cancellations or duplicates are handled.
- Set a target or comparison. Compare with a business goal, the previous period, or a relevant plan. Don’t treat an example value as a universal benchmark.
- Assign a review cadence and owner. Choose a frequency that suits the decision and the data’s refresh rate.
Use the table as a menu, then adjust it to your systems and business model. The data source named is a likely starting point; it still needs to be checked against how your organization records the information.
| Business goal | Example KPI | Likely data source | Review cadence |
|---|---|---|---|
| Close more suitable opportunities | Qualified leads and closed sales | CRM | Weekly |
| Manage near-term cash | Cash received and cash paid | Accounting system or cash-flow spreadsheet | Weekly |
| Understand marketing response | Leads by channel | Web analytics, CRM, or campaign records | Weekly or monthly |
| Deliver work on time | Open work and delivery status | Project-management tool | Weekly |
Leave out measures nobody uses to make a decision, even if a software tool makes them easy to display. Also leave out any KPI without a clear definition: two people can use the same label while counting different things, which makes comparisons misleading.

What are practical KPI dashboard examples for small businesses?
You can adapt focused dashboards for sales, cash flow, marketing, and operations, choosing only measures relevant to your business. Each view should answer a specific question, show a few defined KPIs, and make a possible next action visible. Treat the measures below as examples, not universal targets.
Sales dashboard — Are suitable opportunities moving toward a decision? A small business could track qualified leads, proposals awaiting a response, closed sales, and sales by source. Review it weekly if the team makes follow-up decisions during the week. If qualified leads are steady but closed sales slow, inspect proposal status and follow-up; if lead volume changes, check which sources contributed.
- Purpose: Spot pipeline changes and decide where sales follow-up is needed.
- Measures: Qualified leads, open proposals, closed sales, and source of lead.
- Cadence: Weekly, or at the pace your team reviews opportunities.
Cash-flow dashboard — Is expected cash available for upcoming obligations? Compare cash in and cash out over a consistent period, then show upcoming payments or receivables if the records are reliable. A business may use this view to identify invoices needing follow-up or plan the timing of discretionary spending. It complements, rather than replaces, accounting reports and professional financial advice.
- Purpose: See the direction of cash movement and prepare for near-term commitments.
- Measures: Cash received, cash paid, overdue receivables, and upcoming obligations.
- Cadence: Weekly or more often when cash decisions require it.
Marketing dashboard — Which channels are producing useful inquiries? Track leads by channel and, where records can be connected reliably, whether those leads become qualified opportunities or customers. If one channel brings traffic but few inquiries, check the offer, landing page, or tracking setup before shifting spend. Review monthly for broader patterns and more often when you are actively managing campaigns.
- Purpose: Compare channels based on the business result you care about.
- Measures: Inquiries by channel, qualified leads, and resulting sales when attribution is available.
- Cadence: Monthly, with additional checks during campaign changes.
Operations dashboard — What work is open, blocked, or at risk of late delivery? A service business might track open jobs, current status, due dates, and work waiting on a customer or supplier. If overdue work grows, the owner can review workload, blockers, or scheduling before accepting more commitments.
- Purpose: See delivery status and decide what needs attention.
- Measures: Open work, status, due dates, and delayed or blocked work.
- Cadence: Weekly or at the team’s operational handoff.
For all four views, define the reporting period, record types, and calculation consistently. These KPI dashboard examples are useful templates only when the underlying measures mean the same thing from one review to the next.

See dashboard design prices and scope
How can you build a KPI dashboard step by step?
Start with a business decision and a small, reliable data set before choosing a dashboard tool. Write down what the user needs to know, confirm where the relevant records live, and check that they are usable. A simple first view is easier to validate than a broad report built on uncertain data.
Follow a deliberate build sequence so the dashboard solves a real task rather than becoming another report to maintain:
- Identify the decision. Specify who will use the dashboard and what they might do differently after reviewing it.
- Select a few KPIs. Include outcome measures and, where helpful, process measures that explain changes.
- Document definitions. Record the formula, included records, date field, reporting period, target or comparison, and owner for each measure.
- Locate the data sources. Common sources include accounting systems, CRM platforms, ecommerce or point-of-sale systems, web analytics, spreadsheets, payroll, and project-management tools.
- Check data quality. Find missing records, inconsistent date ranges, duplicate entries, and mismatched KPI definitions before connecting sources.
- Build a first view. Show only the information needed for the chosen decision, with labels and time periods that users can understand.
- Review it with users. Ask them to use it for a real task, note where they hesitate, and correct confusing or unreliable parts.
For example, if the task is finding which sales channel needs attention, a user should be able to compare leads by source and follow their progress into qualified opportunities or sales. Before drawing conclusions, check that channel labels match across the CRM and marketing records, dates cover the same period, and missing source values have not been silently grouped as a channel.
Don’t connect every system just because integration is possible. First inspect a sample of records from each source and reconcile totals against the system people already use. If a spreadsheet and CRM count a lead differently, settle that definition before combining them. Otherwise, a polished view can make inconsistent data look authoritative.
Once users can complete the task, ask what additional measure would change a decision. Add it only if its source and calculation are clear. This keeps the first dashboard practical and gives you a specific reason for every later addition.

Which dashboard tools work for small businesses?
Choose a dashboard tool based on the systems where your data already lives, the reporting you need, who must use the result, and whether your team can maintain it. A spreadsheet or built-in report may be enough for a single, clean source. Multiple sources or more involved analysis may justify a business intelligence platform.
The tools below serve different needs, but their features and suitability depend on your setup. Treat this as a starting comparison, not a ranking.
| Tool | Typical fit | Relevant strengths | Points to check before choosing |
|---|---|---|---|
| Power BI | Teams working with Microsoft tools or combining business data sources | Supports interactive reporting and data modeling across connected sources | Check licensing, connector availability, permissions, refresh needs, and who will maintain the model. |
| Looker Studio | Teams seeking shareable reports, often using web and marketing data | Can present connected data in visual reports for collaborators | Confirm that required connectors and data blending suit your sources; review access and refresh behavior. |
| Tableau | Teams needing visual exploration and more involved analysis | Provides interactive visual analysis and reporting options | Check current licensing, setup needs, data connectivity, user access, and the skills needed to maintain reports. |
Tool features, pricing, connectors, and licensing can change. Verify current terms with the provider and check the exact capabilities available to your team rather than assuming a feature or price applies to every plan.
A spreadsheet can work well when a report uses one dependable source, a small group of users, and a straightforward calculation. A built-in accounting or sales report may be even simpler if it already answers the question. A BI platform becomes more useful when you need repeatable reporting across several sources, interactive filtering, or shared access controls.
Before deciding, confirm that intended users can access and understand the report, that permissions protect sensitive data, and that refresh frequency matches the decisions being made. Assign ongoing ownership: someone must handle source changes, definition updates, access requests, and questions about the numbers. A powerful platform without a maintainer can become less useful than a modest report the team trusts.

Find dashboard design on Fiverr
How much does a KPI dashboard cost, and how long does setup take?
Dashboard cost and setup time depend on data readiness, the number of sources, dashboard complexity, tool choice, and whether you need outside implementation help. A limited view using one clean source is different from a multi-source BI project that requires data cleanup, integrations, access controls, and training.
There isn’t a responsible universal price or timeline without a defined scope. Separate the work into cost categories so you can compare options and see what an estimate actually covers:
- Software or licensing: The cost of the spreadsheet, reporting feature, or BI platform and any required user licenses.
- Setup and data cleanup: Time to define KPIs, fix inconsistent records, and prepare data for reporting.
- Integrations: Connecting systems and checking that records and date ranges reconcile.
- Consulting and implementation: Planning, building, testing, and documenting the dashboard.
- Training and maintenance: Helping users interpret the report and keeping it accurate as tools, definitions, or workflows change.
A single-source dashboard may involve confirming a few calculations and presenting them clearly. A larger project may need to map fields across accounting, CRM, and ecommerce systems; resolve duplicate or missing records; set permissions; and test refresh behavior. Those requirements affect both effort and delivery, so a quote should describe deliverables and assumptions rather than just name a total.
Use this planning checklist before requesting an estimate:
- Inventory each data source and identify who can provide access.
- Confirm data quality, including missing records, duplicates, and inconsistent definitions.
- Define deliverables: measures, views, integrations, permissions, documentation, and training.
- Identify the internal owner who will answer questions and maintain the dashboard.
- Ask providers to estimate the same scope, assumptions, and ongoing support needs.
Do not compare proposals that cover different work. One estimate may include data cleanup and training while another covers only the initial report. Ask what could change the schedule, how acceptance will be tested, and what support is available after handoff. That gives you a clearer basis for planning without relying on a misleading one-size-fits-all estimate.
What should you do next to put a KPI dashboard to work?
Choose one business decision, build a small first dashboard around it, and review whether the view changes what you do. Start with an available, dependable data source and a few defined measures. If users can take a clearer action after reviewing the dashboard, you have a sound basis for improving it.
Turn that first version into a practical routine:
- Select a business goal. Make it specific enough to guide a decision, such as improving proposal follow-up or spotting delivery delays.
- Assign KPI owners. Name who verifies the measure and who acts when it changes.
- Confirm data sources. Check that records are available, definitions align, and dates match the reporting period.
- Choose a tool. Use the simplest option that meets your reporting, access, and maintenance needs.
- Build and test a first version. Ask a real user to complete a real task with it before expanding the report.
- Schedule a regular review. Set a cadence that fits the decision, then remove or revise measures that no longer help.
Document each KPI’s definition, calculation, source, reporting period, and owner. Also document who maintains the dashboard and what to do when a source changes. This prevents two teams from interpreting the same label differently and gives users a clear route for reporting errors or requesting changes.
Consider getting support if data is fragmented across systems, reporting requires recurring manual work, or people disagree about what a metric means. You may also need help deciding whether BI or AI adoption planning fits a specific business problem. A focused discussion can clarify the use case, data readiness, required skills, and sensible next step before you commit to a larger project.
AI & Data Consulting Desk helps small and mid-size businesses plan analytics, BI dashboards, automation, and AI or data roadmaps in practical terms. If you’re an owner or operations leader deciding where to start, explore its consulting guidance and services to plan a useful first step.
Executive summary
- Choose KPIs that support a real business decision, and define how each one is calculated.
- Start with a focused sales, cash-flow, marketing, or operations view rather than trying to display every available metric.
- Check data quality and test the dashboard with a real user task before connecting more sources or adding measures.
- Compare tools and project estimates against your data sources, access needs, deliverables, and ongoing ownership responsibilities.
- Assign KPI owners, document definitions, and schedule regular reviews so the dashboard leads to consistent action.
- Start with one of these KPI dashboard examples, keep it to a few measures, and review it on a fixed schedule.
Common client questions
- What should a small-business KPI dashboard include?
Include a small number of clearly defined measures tied to a business decision, such as sales progress, cash movement, marketing inquiries, or open operational work. Show the reporting period and identify who reviews each KPI.
- How many KPIs should a small business track?
There isn’t one right number for every business. Start with the few measures needed to answer a specific question, then add another only when it supports a decision and has a reliable definition and source.
- What is the difference between a KPI and a metric?
A metric is a measured quantity, while a KPI is a measure selected to track progress toward an important business goal. A dashboard can show supporting metrics, but each KPI should have a clear purpose.
- Can I build a KPI dashboard in a spreadsheet?
Yes, a spreadsheet can be suitable when the data comes from a manageable source, calculations are straightforward, and the users can maintain the report. Consider a reporting or BI tool when you need recurring updates across sources, more analysis, or controlled access.
- How often should a KPI dashboard update?
Set the refresh and review frequency according to the decision and how often the source data changes. A weekly operational review may work for open jobs, while broader marketing comparisons may be reviewed less often.
- What are the most useful small-business dashboard tools?
Power BI, Looker Studio, and Tableau are options for business intelligence reporting, while spreadsheets and built-in system reports can be enough for simpler needs. Compare current pricing, connectors, permissions, accessibility, refresh behavior, and the team’s ability to maintain the setup.
